Amazon Web Services Feed
Deploy a dashboard for AWS WAF with minimal effort
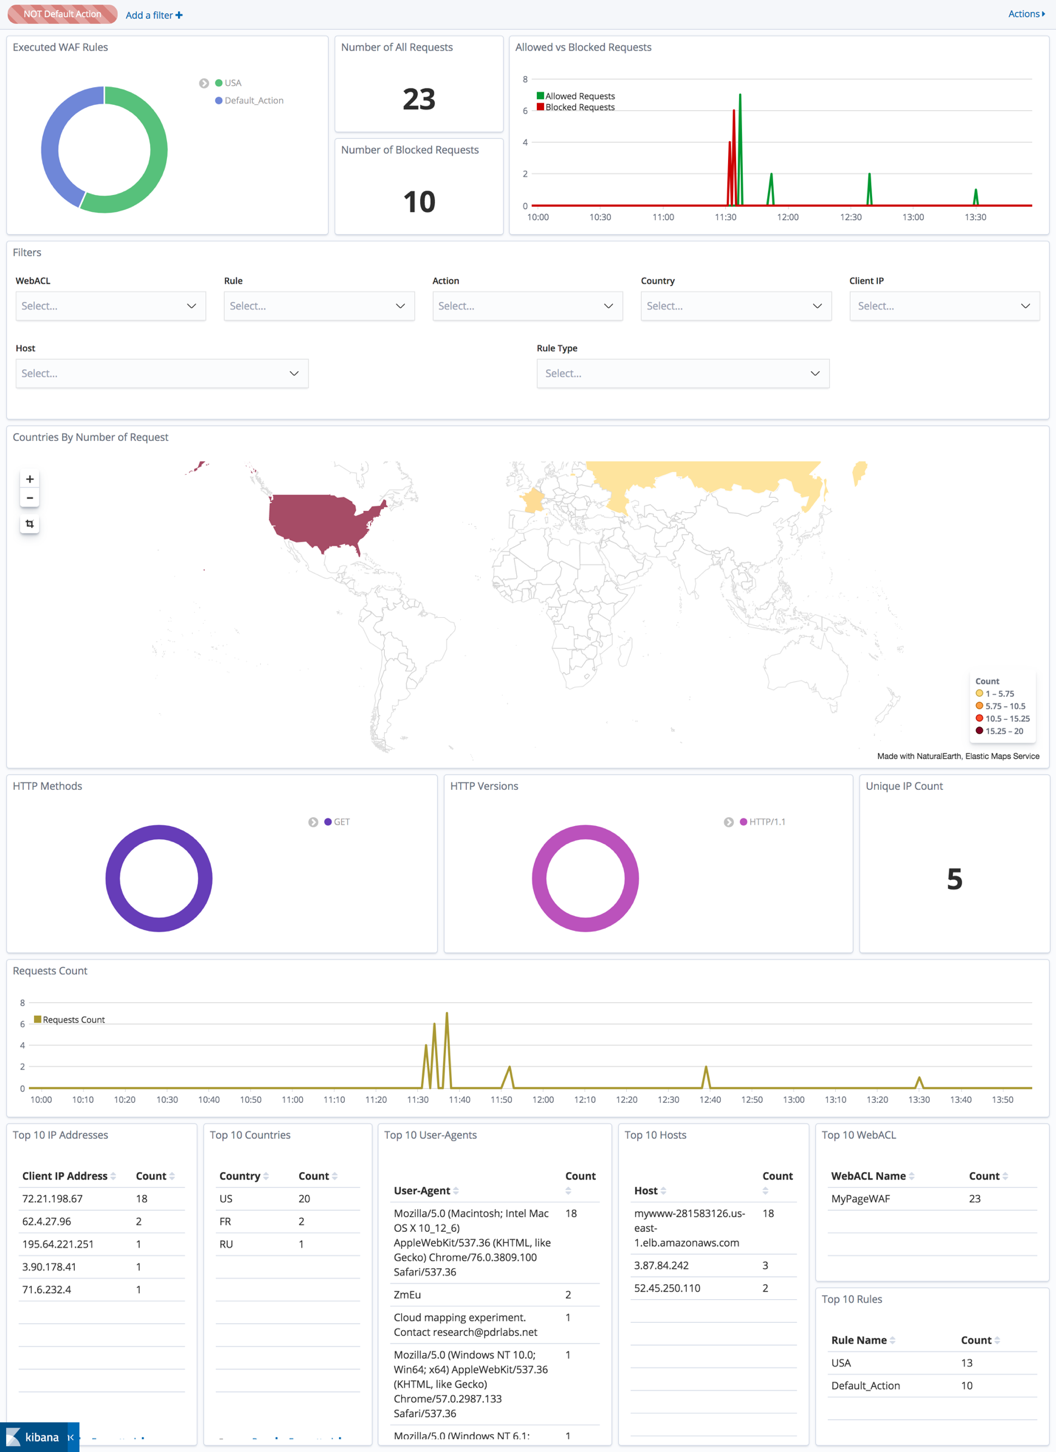
In this post, I’ll show you how to deploy a solution in your Amazon Web Services (AWS) account that will provide a fully automated dashboard for AWS Web Application Firewall (WAF) service. The solution uses logs generated and collected by AWS WAF, and displays them in a user-friendly dashboard shown in Figure 1.
Figure 1: User-friendly dashboard for AWS Web Application Firewall
The dashboard provides multiple graphs for you to reference, filter, and adjust that are available out-of-the-box. The example in Figure 1 shows data from a sample web page that I created, where you can see:
- Executed AWS WAF rules
- Number of all requests
- Number of blocked requests
- Allowed versus blocked requests
- Countries by number of requests
- HTTP methods
- HTTP versions
- Unique IP count
- Request count
- Top 10 IP addresses
- Top 10 countries
- Top 10 user-agents
- Top 10 hosts
- Top 10 web ACLs
The dashboard is created using Kibana, which provides flexibility by enabling you to add new diagrams and visualizations.
AWS WAF is a web application firewall. It helps protect your web applications or APIs against common web exploits that can affect availability, compromise security, or consume excessive resources. In just a few steps, you can deploy AWS WAF to your Application Load Balancer, Amazon CloudFront distribution, or Amazon API Gateway stages. I’ll show you how you can use it to get more insights into what’s happening at the AWS WAF layer. AWS WAF provides two versions of the service: AWS WAF (version 2) and AWS WAF classic. We recommend using version 2 of AWS WAF to stay up to date with the latest features as AWS WAF classic is no longer being updated. The solution that I describe in this blog post works with both AWS WAF versions.
The solution is swift to deploy: The dashboard can be ready to use in less than an hour. The solution is built with multiple AWS services such as Amazon Elasticsearch (Amazon ES), AWS Lambda, Amazon Kinesis Data Firehose, Amazon Cognito, Amazon EventBridge, and more. However, you don’t need to know those services in detail to build and use the dashboard. I prepared a CloudFormation template that you can deploy in the AWS Console to set up the whole solution automatically on your AWS account. You can also find the whole solution on our AWS Github. It’s open source, so you can use and edit it to meet your needs.
The architecture of the solution can be broken down into 7 steps, which are outlined in Figure 2.
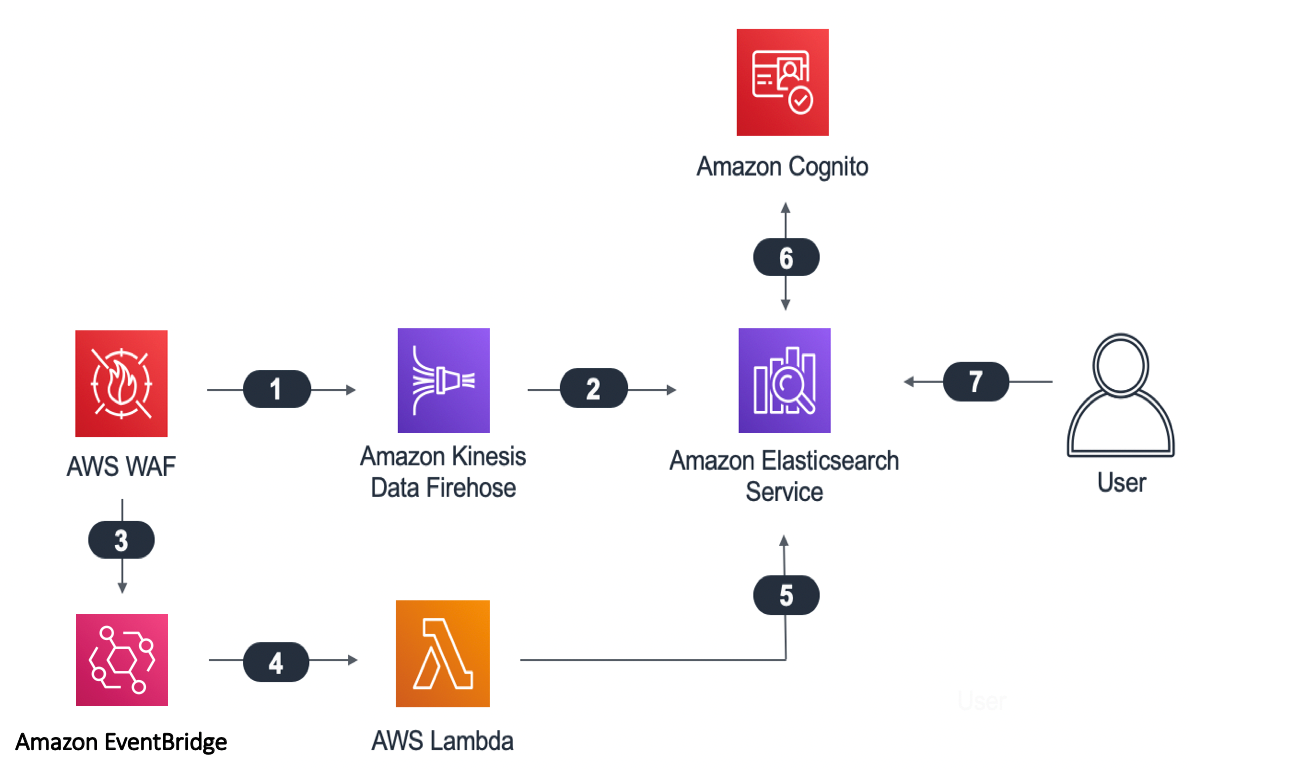
Figure 2: Interaction points while architecting the dashboard
The interaction points are as follows:
- One of the functionalities of AWS WAF service is AWS WAF logs. The logs capture information about blocked and allowed requests. These logs are forwarded to Kinesis Data Firehose service.
- Kinesis Data Firehose buffer receives information, and then sends it to Amazon ES—the core of the solution.
- Some information, like the names of AWS WAF web ACLs aren’t provided in the AWS WAF logs. To make the whole solution more friendly for users, I used EventBridge, which will be called whenever a user changes their configuration of AWS WAF.
- EventBridge will call a Lambda function when new rules are created.
- Lambda will retrieve the information about all existing rules and it will update the mapping between IDs of the rules and their names in the Amazon ES cluster.
- To make the whole solution more secure, I’m using Amazon Cognito service to store the credentials of authorized dashboard users.
- The user enters their credentials to access the dashboard on Kibana which is installed on Amazon ES cluster.
Now, let’s deploy the solution and see how it works.
Step 1: Deploy solution using CloudFormation template
Click Launch Stack to launch a CloudFormation stack in your account and deploy the solution.
![]()
You’ll be redirected to the CloudFormation service in North Virginia, USA, which is the default region to deploy this solution for an AWS WAF WebACL associated to CloudFront. You can change the region if you want. This template will spin up multiple cloud resources, including but not limited to:
- Amazon ES cluster with Kibana for storing data and displaying dashboard
- Amazon Cognito user pool with a registry of users who have access to dashboards
- Kinesis Data Firehose for streaming logs to Amazon ES
In the wizard, you’ll be asked to modify or provide four different parameters. They are:
- DataNodeEBSVolumeSize: Storage size of Amazon ES cluster which will be created. You can leave the default value.
- ElasticSearchDomainName: Name of your Amazon ES cluster domain. You can leave the default value.
- NodeType: Type of the instance which will be used to create Amazon ES cluster. You don’t need to change it if you don’t want to, but you can if necessary to accommodate your needs.
- UserEmail: You must update this parameter. It is the email address that will receive the password to log in to Kibana.
Step 2: Wait
The process of launching a template, which I named aws-waf-dashboard for this example, will take 20–30 minutes. You can take a break and wait until the status of the stack changes to CREATE_COMPLETE.
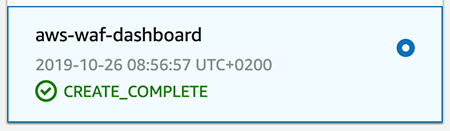
Figure 3: Completed launch of the CloudFormation template
Step 3: Validate that Kibana and dashboards work
Check your email. You should have received an email with the required password to log in to the Kibana dashboard. Make a note of it. Now return to the CloudFormation service and select the aws-waf-dashboard template. In the Output tab, there should be one parameter with a link to your dashboard in the Value column.
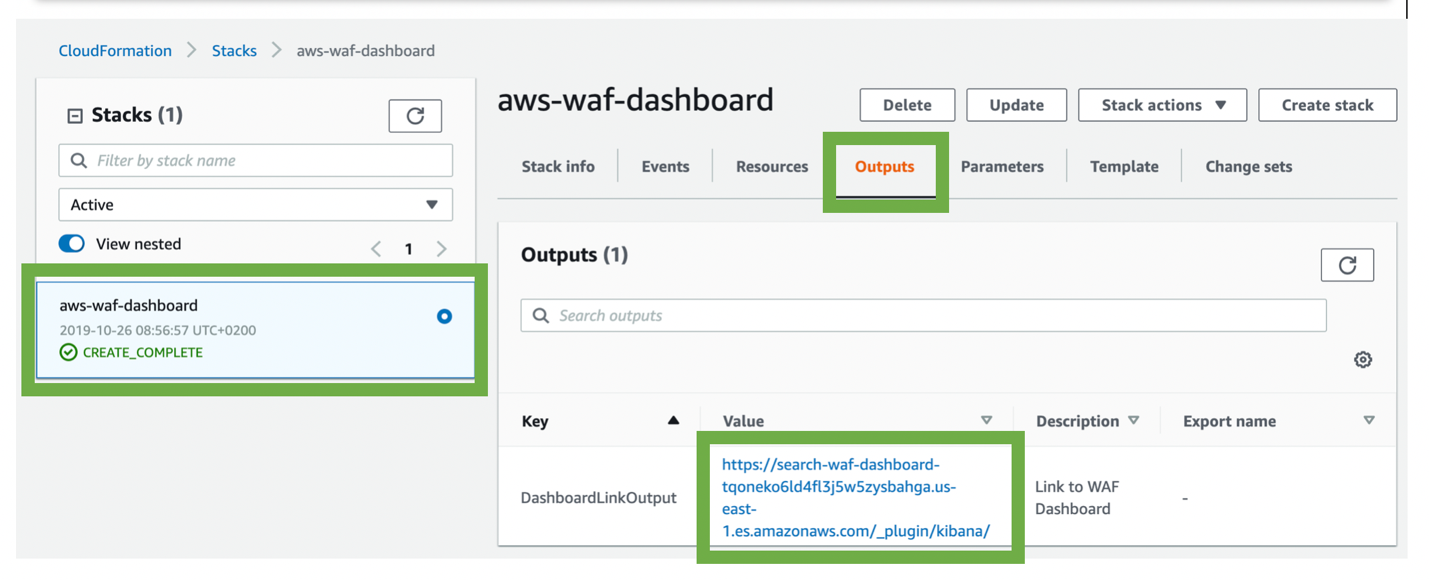
Figure 4: Output the CloudFormation template
Select the link and log in to Kibana. Provide the email address that you set up in Step 1 and the password that was sent to it. You might be prompted to update the password.
In Kibana, select the Dashboard tab, as shown in Figure 5, and then select WAFDashboard in the table. This will call up the AWS WAF dashboard. It should still be empty because it hasn’t been connected with AWS WAF yet.
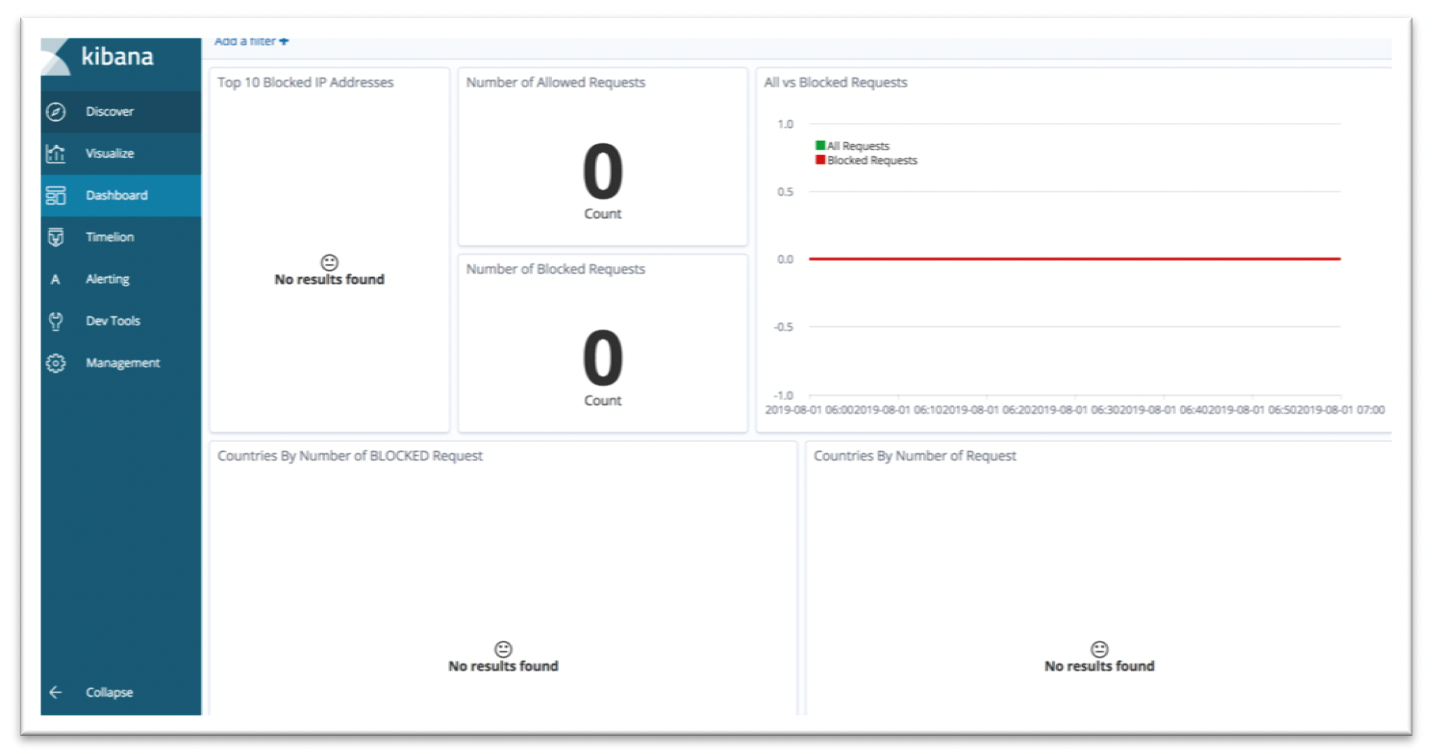
Figure 5: Empty Kibana dashboard
Step 4: Connect AWS WAF logs
Now it’s time to enable AWS WAF logs on the web ACL for which you want to create a dashboard and connect them to this solution. Open AWS WAF, select the AWS WAF dropdown option, select Web ACLs, and then select your desired web ACL. In this example, I used a previously created web ACL called MyPageWAF, as shown in Figure 6.
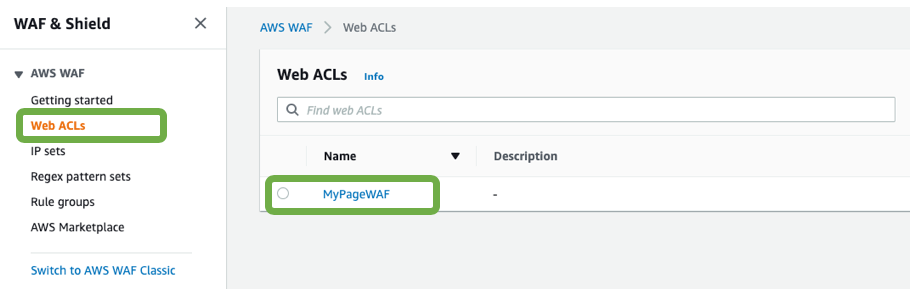
Figure 6: WAF & Shield
If you didn’t enable AWS WAF logs yet, you need to do it now in order to continue. To do this, select Logging and metrics in your web ACL, and then Enable logging, as shown in Figure 7.
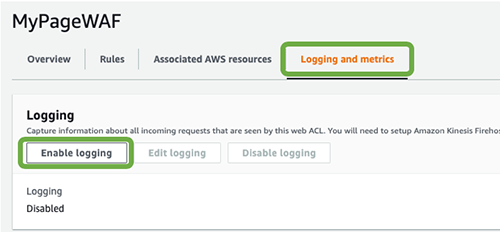
Figure 7: Enable AWS WAF logs
Select the drop-down list under Amazon Kinesis Data Firehose Delivery Stream and then select the Kinesis Firehose which was created by the template in step 2. Its name starts with aws-waf-logs. Save your changes.
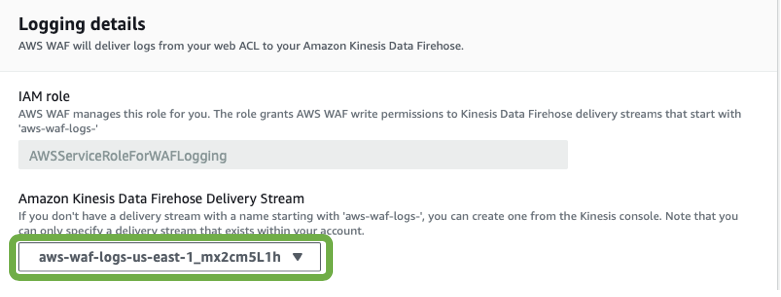
Figure 8: Select the Kinesis Firehose
Step 5: Final validation
Your AWS WAF logs will be sent from the AWS WAF service through Kinesis Data Firehose directly to an Amazon ES cluster and will be available to you using Kibana dashboards. After a couple of minutes, you should start seeing data on your dashboard similar to the screenshot in Figure 1.
And that’s all! As you can see, in just a few steps we built and deployed a solution, which we can use to examine our AWS WAF configuration and see what kind of requests are being made and if they’re blocked or allowed.
Sample Scenario
Let’s go through a sample scenario to see one way you can use this solution. I built a small website for my dog and configured CloudFront to accelerate it and to make it more secure.
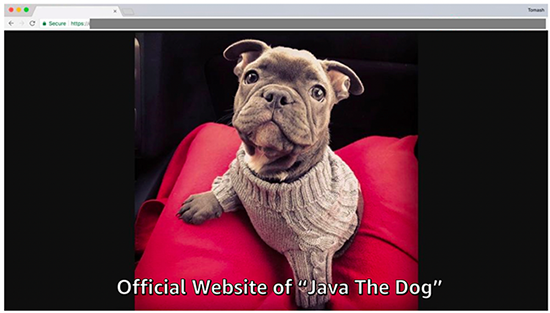
Figure 9: Java the Dog’s homepage
Next, I configured an AWS WAF web ACL and attached it to my CloudFront distribution, which is the entry point of my website. In my AWS WAF web ACL, I didn’t add any rules, but allowed all requests. This will allow me to log all requests and understand who is visiting my website. Then I configured an AWS WAF dashboard by following the steps in this blog.
My imaginary website is mainly dedicated to three countries—USA, Germany and Japan—where French Bulldogs are very popular. I noticed that I got quite a lot of users from India, which was unexpected. In Figure 10, the AWS WAF dashboard includes data from all four countries and tells me there have been over 11,000 requests for my website.
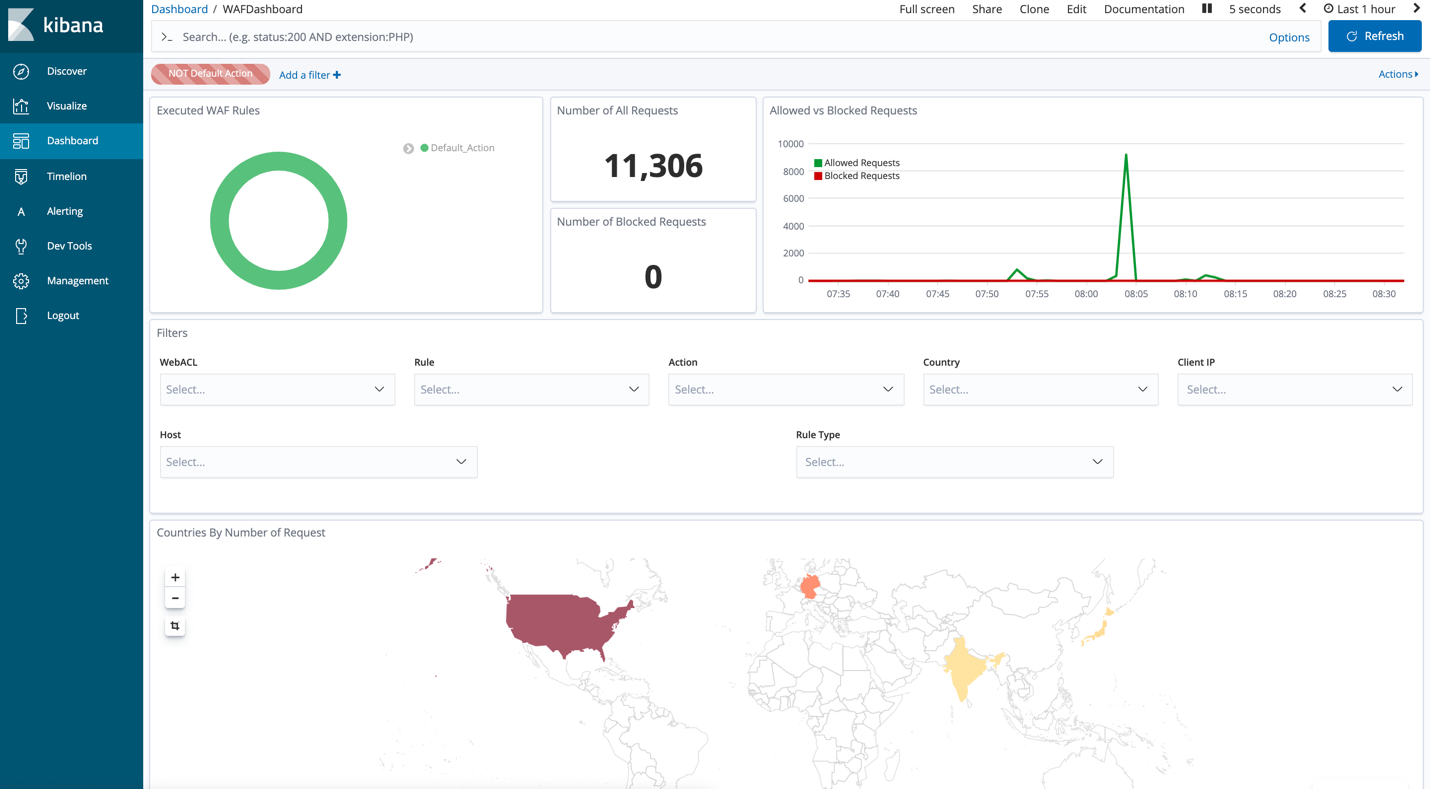
Figure 10: Kibana dashboard with requests from USA, Japan, Germany, and India
To understand the data better, I filtered on requests coming only from India, which is shown in Figure 11:
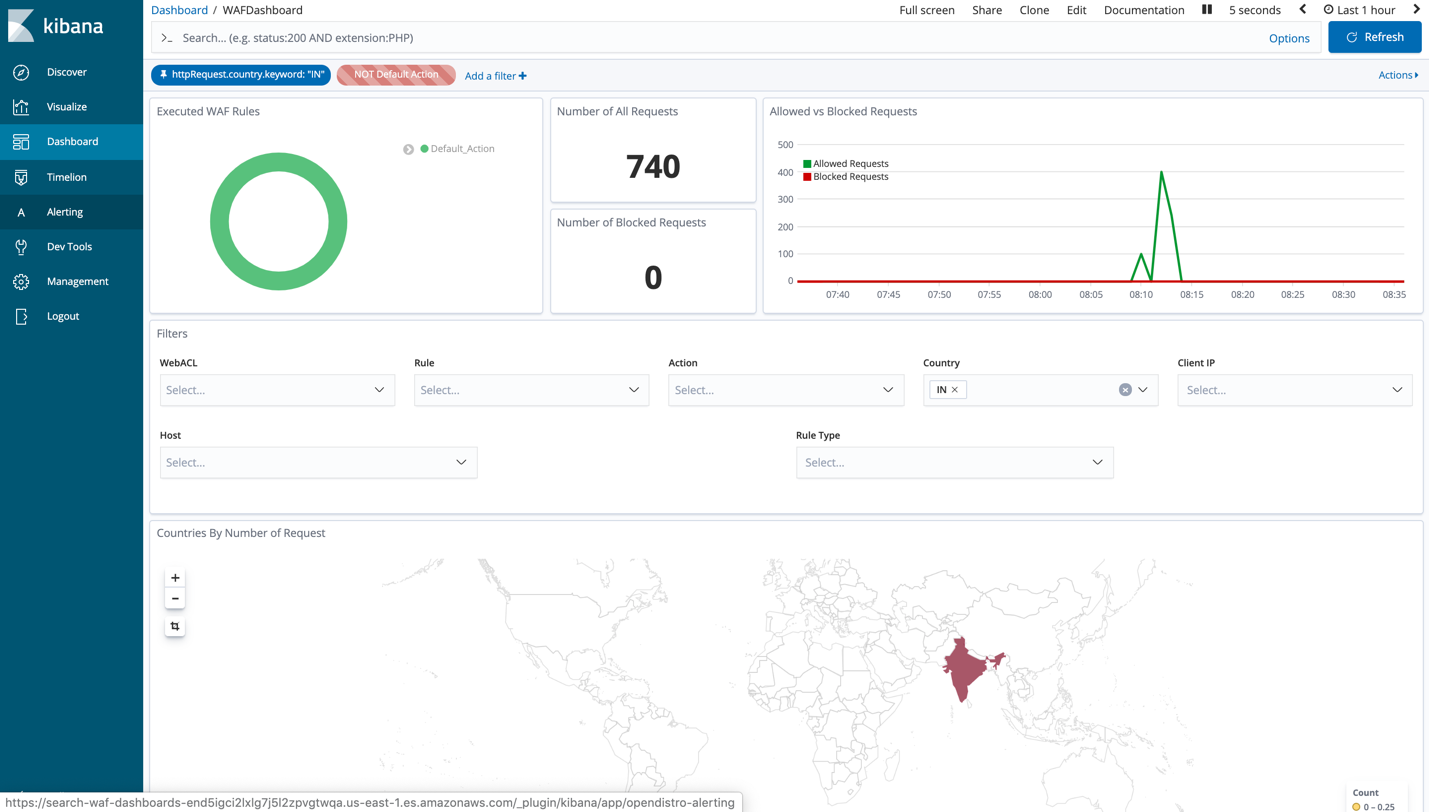
Figure 11: Website requests coming from India only
The dashboard shows that I got more than 700 requests from India in the previous hour. This could have been a great success for my website, but unfortunately, all the requests were coming from single IP address. Additionally, most of them have a suspicious user-agent header: “secret-hacker-agent.” This information is provided in the Visualize tab in Kibana, shown in Figure 12.
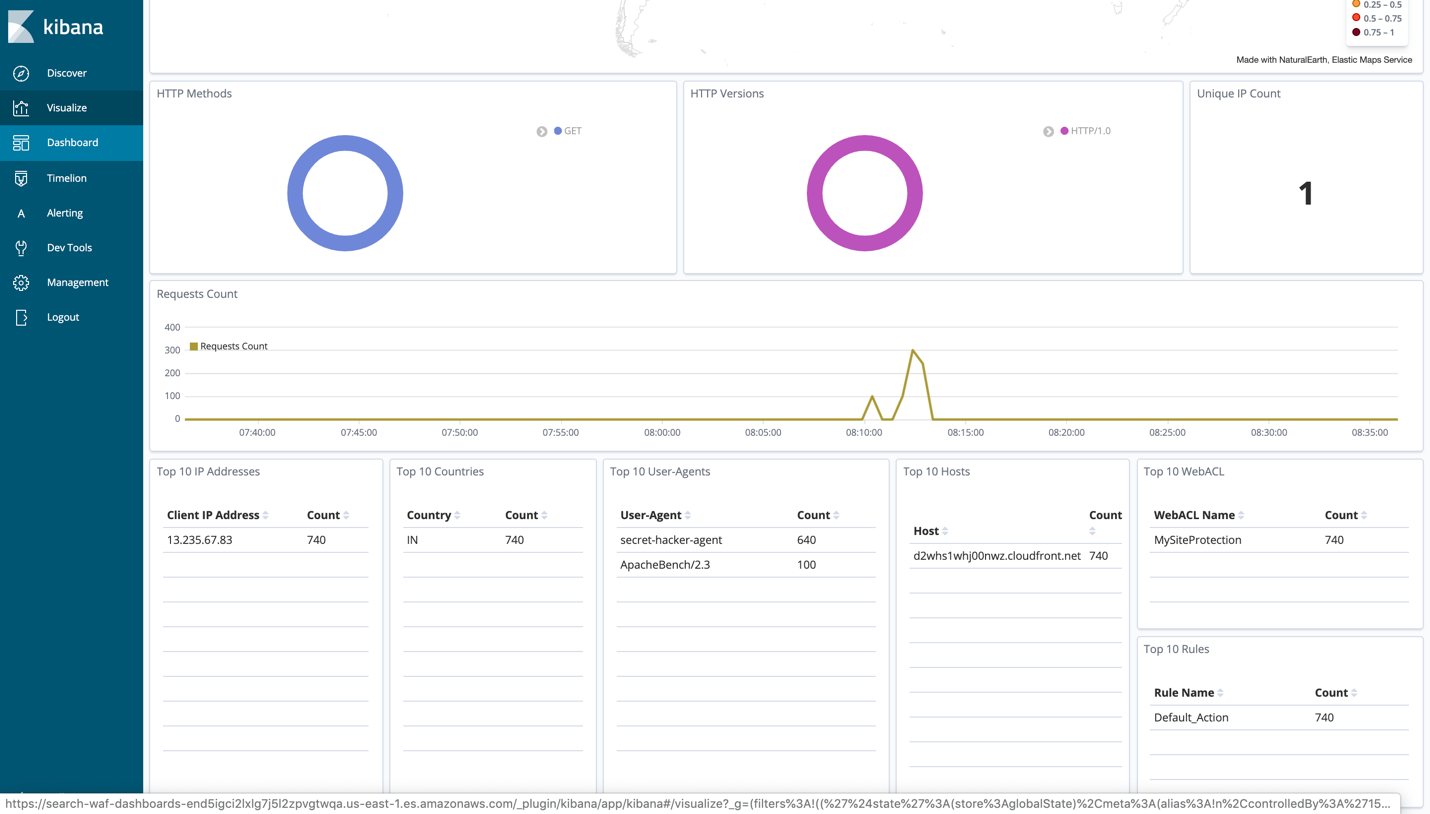
Figure 12: Visualize tab of Kibana dashboard
This doesn’t look good, so I decided to block those requests using AWS WAF.
So, the question now is what to block exactly? I can block all requests coming from India, but this isn’t the best idea because there might be other Indian fans of French Bulldogs. I can block this single IP address, but the hacker might use a different IP to continue hitting my website. Finally, I decided to create an AWS WAF rule that inspects the user-agent header. If the user-agent header contains “secret-hacker-agent,” the rule will block the request
Within a couple of minutes of configuring my AWS WAF rule, I noticed that I was still getting requests from India, but this time, requests with the suspicious user-agent header were blocked! As shown in Figure 13, there were around 2,700 requests, but about 2,000 of them were blocked.
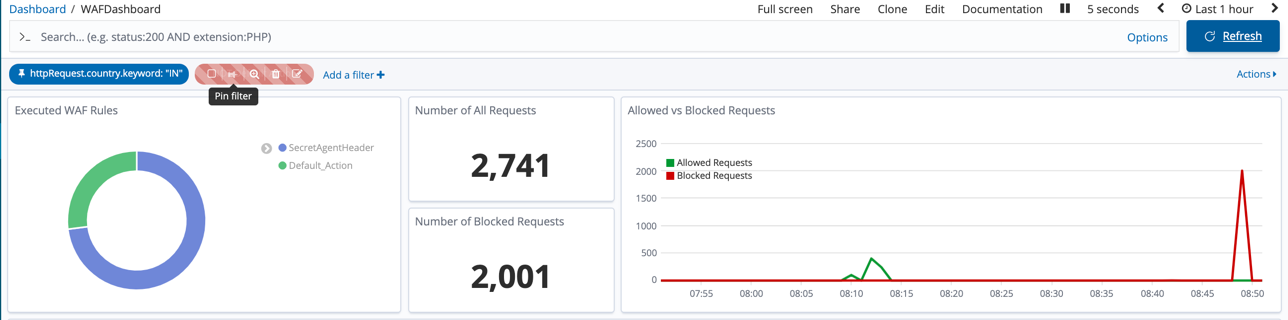
Figure 13: Blocked suspicious requests
In reality, I was attacking my own website as secret-hacker-agent for the sake of the example. You can see in the following command line screenshot that my request (using wget) with the suspicious user-agent header was blocked (receiving a “403 Forbidden” message). When I use a different header (“good-agent”), my request passes the AWS WAF rule successfully.
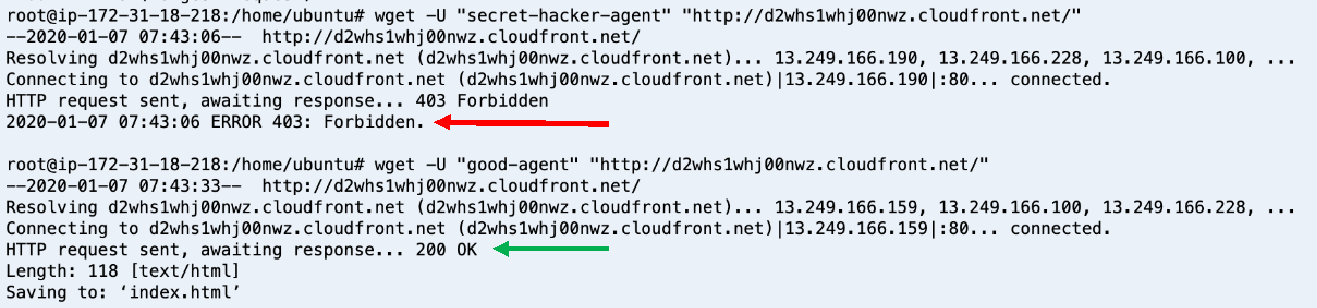
Figure 14: Command line screenshot of the ‘wget’ request
Summary
In this post we’ve detailed how to deploy a dashboard for AWS WAF in a few steps, and how to use it to troubleshoot and block a web application attack. Now it’s your turn to deploy this solution for your own application. Please share your feedback about the solution and the dashboard. You can submit comments in the Comments section below or on the project’s GitHub page.
This post was inspired by a blog post created by my friend Tom Adamski, who also described how to use Kibana and Amazon ES to visualize AWS WAF logs, and with help of Achraf Souk, who contributed his specialist knowledge in AWS edge services.
Want more AWS Security how-to content, news, and feature announcements? Follow us on Twitter.